


It is Still About Valuations
... better change tires as it is going to rain ... a lot!

Part I - Market Views
Part II - R4A applications - using the Discovery and Strategies
Watch Demo Videos about R4A Implementation
PART I – Market Views
Valuations are stretched and (very) vulnerable ...
Presuming that market performance is a function of valuations plus earnings, the conventional narrative out there has been that 2022 was all about valuations as real yields rose, while 2023 will be all about earnings expecting a recession. Valuation levels are indeed affected by the level of interest rates, while earnings are a function of the macro backdrop, i.e., topline growth (GDP) and margins (labor costs, inflation) will drive the bottom line (EPS growth). Given the macro backdrop and unsettled inflation, our view is that the conventional narrative is way off the mark, i.e., valuations will continue to be THE negative driver for the market in 2023, more so than the widely expected earnings deterioration.
... as monetary policy stance is not fully priced in ...
The reason is simple: current market yields and policy rates are not consistent with the stated inflation targets, e.g., 2 percent, especially since real yields continue to be in deep negative territory. While inflation may be subsiding somewhat reflecting primarily exogenous factors (supply chain, Covid-induced pent-up demand, oil & gas prices) ... we are just too far from the comfort zone whereby monetary authorities would stand back or stand by. Indeed, it is just puzzling how many out there expect a pivot to a pause or cut in policy rates by year-end. Hence active and aggressive central banks will continue to affect valuations until real yields are consistent with inflation targets and accordingly in line with multiples ... hence the huge relative valuation gap shown in the Graph below:
Graph 1 – S&P500 Forward P/E vs. Real Yields (measured by US TIPs) (Source: Bloomberg)

... particularly since the economy is not rolling over ...
The added conviction to this argument is the persistent evidence that major economies will avoid a recession ... indeed the only widely quoted indication of the contrary is the inversion of major markets yield curves and tight financial conditions ... not definite indicators. Thus, good prints on the economy and evidence of a soft landing may in fact make the central bank tightening stances easier to implement.
Indeed, the real economy continues to surprise positively. Europe, or the perceived weakest link in the global chain, is now expected to avoid a recession as energy costs, expected to skyrocket by triple digits until a few months back, declined to prewar levels, removing a major headwind to growth. China’s “opening” is expected to generate impressive growth numbers, albeit we would caution against being too sanguine: real estate, or 25 percent of the economy, is still unable to clear without government support; in addition, Covid could continue to create massive damages until natural immunity takes over, while the Common Prosperity goal could turn out to be expensive for corporate margins, investment, and growth. In the United States, the combination of historically low unemployment (too many job openings, not too many employed!) and rising wages are sustaining real disposable income and retail sales, while Capex is expected to react to the supply chain disruption and a massive Infrastructure program. Meanwhile, tighter policy mixes have peaked in Emerging markets; add to that an expected peak in the US Dollar (if not an outright decline) and conditions for growth have much improved there as well, particularly in Emerging Asia.
... and is instead “soft-landing” ...
Accordingly, the IMF in its January 2023 World Economic Outlook Update projected that global growth will fall to 2.9 percent in 2023, 0.2 percentage point higher than predicted in October 2022. While still below the 3.8 percent historical average, it does point out lower recession risks, read an (encouraging) soft landing. To be sure, and despite the lower probability, the risk is still skewed on the downside reflecting pernicious inflation, necessary tight policy mixes, and rising geopolitical risks.
... and generating an earnings recession instead ...
Nonetheless, avoiding a recession will not be sufficient to dodge a decline in earnings, particularly if (or because of) rising costs will continue to pressure operating margins. Indeed, a combination of modest top-line growth compression (i.e., the soft-landing scenario) and a (modest as well) narrowing of profit margins due to higher costs (wage inflation) is most likely going to result in an earning recession across major market blocks, with the notable exception of Japan (see Table 1 below).
Table 1 - Earnings Per Share top-down Consensus Expectations

To that end, the US market is indeed the most vulnerable to surprises (and volatility either ways) having both high margins relative to history and a much higher level of Operating Leverage considering the heavy weight of tech in the US benchmarks.[1] I.e., a modest decline in the top line has a higher impact on EPS. However, note, Operating Leverage works both ways: a small increase in growth can have an outsized (positive) impact on EPS ... (a very strong argument for owning tech stocks and software in particular).
... leading to a “poor-to-bleak” Market Outlook.
Assuming the soft landing as the base case scenario and accepting the market top-down expectation for modest declines in EPS (Table 1 above), the market seems to be priced to perfection, particularly considering the rally YTD ... a quintessential short-covering rally of course! I.e., even assuming a Goldilocks type of scenario, the market upside is limited, returning for 2023 just about the dividend or ~ 2 percent (see Table 2 below) best case.
Table 2 - Consensus Scenario: Priced to Perfection!

Now, if valuations on the other hand succumb again to higher-than-expected policy rates amidst stubbornly higher inflation (or just much above-stated targets) and using the same level of multiples (P/Es) reach in the previous trough (Fall 2022 - amidst peak expectations of very aggressive monetary policies and peak in yields) the downside could be brutal, e.g., ~20 percent across the US and Europe (See Table 3). The exception could be Emerging markets, albeit the results will ultimately depend on China and the US Dollar peaking, neither a given.
Table 3 - Worst Case Scenario

... in conclusion:
The most compelling argument above is that even in the absence of a recession (or possibly because of the absence of one) the outlook goes from “priced to perfection” to another leg down of the bear market that started in 2022 as valuations could capitulate amidst much more aggressive monetary tightening and higher real yields ... as implied by Graph 1 above. Add to it the risk of a recession (small but still there) and a much bigger-than-expected decline in EPS (down 12-14% according to historical averages of previous recessions), and the outlook turns ugly very quickly.
In Part II, we will describe how to build investment solutions with R4A (Lumen’s Robo4Advisors) following and applying the outlook depicted above.
PART II – R4A Applications
Using the Discovery and Strategy Modules
Given the backdrop and outlook outlined above, considering a defensive investment strategy as a core position is a no-brainer, e.g., actively “skewing” portfolios with positions in defensive sectors such as Consumer Staples, Utilities, etc. The trouble is that valuations are stressed in these (defensive) sectors as well ... and with a sizeable downside.
Indeed, filtering through global markets using R4A’s Discovery (countries) and Global Strategies modules and applying the results to a Residual Income Model we estimated the intrinsic value for a selected set of global benchmarks. Using the S&P sectors as the bar, the table below shows that of the three traditional defensive sectors (in blue), one is fairly priced (consumer staples) and the other two (Health Care and Utilities) have sizeable downsides.
Table 4 – Intrinsic Value of Selected Global Markets
R4A Input & Residual Income Model (as of February 18)
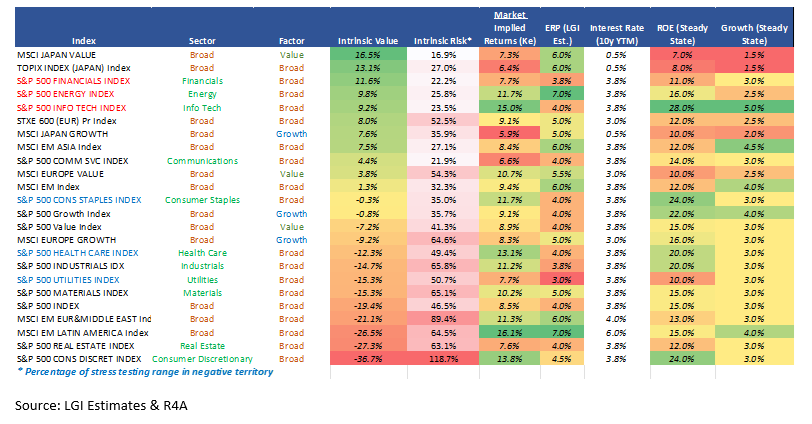
However, and using the same set of assumptions, three sectors that are instead traditionally considered cyclical & growth have some of the most attractive intrinsic values. Rather than a paradox, this is just another example of the futility of using market labels, e.g., defensive, aggressive, and in the process disregarding value wherever that may be. Indeed, given the current backdrop, the best defensive strategy ought to be in industries where profit margins are either immune to, or capable of absorbing rising costs without much impacting the bottom line much. R4A’s Discovery and Strategies modules helped us in assessing and identifying exactly that, thus reinforcing the results in Table 4 above:
Energy , albeit an old story (and a crowded trade) is still attractive. Given the little difference of fundamentals across major global names reported by our Platform, simply buying a global energy benchmarks (or ETFs) and hedging with the actual commodity as implied by R4A Landing Page (need login) seems to be an optimal strategy.
Banks also make sense as higher-than-expected policy rates will push up Net Interest Margins, while soft-landing will reduce the potential impact on credit cost (lower default). Yet there is quite a bit of regional and profitability differences. Hence, we screened this global space via the Strategy Module to identify more granular opportunities:
Click on Strategies => Asset Types < securities> => Asset Class <equities> => Sectors < Financials> <banks> <banks> <diversified banks> => Markets <DM>, and R4A generates 107 global names. Review the list in the following screen and “pick” names or groups where the ROE – Ke (EVA[2]spread) is the highest with the lowest leverage.
Information Technology is a more laborious option as the sector has a garden variety of subindustries with widely different profitability and different vulnerability to top-line growth. E.g., intuitively Application Software is bound to be less vulnerable to top-line growth and production costs (stable margins). And the most obvious place to research and appreciate these differences is by far the US Tech sector given its size and diversity of subindustries. Thus:
o Click on Discovery, then US, <All Listed>, <SPX>, <Information Technology>, <Software & Services>, <Application Software>. The resulting list includes 12 names, most all of them attractive on an ~ EVA Spread (ROE – Ke).
o Corollary: Given the top-down call on this subindustry, use the Aggregate function to circumvent stock picking and build an exposure to a basket of names instead ... i.e., build a custom mini-ETF, a.k.a. Direct Indexing.
Away from these sectors, the Table 4 also points out the attractive intrinsic value in both Japan and Europe as regions. Japan is the most attractive boasting both the highest intrinsic value in the table and having one of the lowest country Beta to global markets (~ 0.52 relative to the MSCI All Countries). It is also an effective macro diversifier away from tighter monetary policies (the Bank of Japan remains the odd man out with its persistent accommodative stance), and ready to profit from a very competitive FX rate particularly in a global soft-landing scenario. Quickly checking using the Discovery module (Click on Discovery => Japan <All Listed>, <TPX>) confirms that all sectors have an attractive EVA Spread, except for Financials (~ 10 % weight), and Utilities (~1% weight), thus making exposure to the overall benchmark simple and efficient, targeting both value and diversification.
Europe (or the SXXP benchmark) also looks attractive on pure market allocation, particularly since the region seems to have successfully skirted a recession amidst the sharp retracement of energy costs to prewar levels. However, playing Beta like Japan, or picking sectors may not be optimal and is instead complex given the diversity (fundamentals and value) across the region. Hence, a factor approaches may make more sense (and have been successful) in managing region-wide European exposure. To that end, the Table above conveys that Value is more attractive than Growth ... incidentally, consistent with our view that Europe is hardly ever a growth story. Note however that this result is based on ETFs using (the treacherous) multiples as a factor metric, e.g., classifying high Value as low P/Es! A much more granular and precise is instead to filter for Value at the individual name level using fundamentals. Using the Platform:
Click on Strategy => Asset Types < securities > => Asset Class <equity> => Factors <Value>. => Regions <DM Europe>, and the system will generate a trove of European Value Opportunities (247 names across countries and sectors) for the active stock picker with the value measured by also a proxy EVA spread, or ROE – Ke!
Last, and given the noise generated by the “opening”, China deserves a more detailed analysis across sectors (Discovery), factors (Strategies) and fundamentals. As already mentioned above and to the risk of sounding contrarian, there are good reasons to remain (very) cautious: Covid may still surprise negatively until full natural herd immunity is reached; the Real Estate sector (25% of the economy) cannot survive without constant Government intervention, and the Common Prosperity policy has so far been a discretionary (arbitrary) slashing of corporate profits ... where there are some! Add to that the lingering (rising) geopolitical backdrop and the risk starts stacking up! I.e., a blind top-down Beta strategy may turn out to be riskier than expected. Indeed, using the Discovery module:
(Discovery => China => All Listed < SHSZ300 index>) highlights very clearly the wide dispersion across sectors ... and the opportunity (necessity) to be selective.
Accordingly, using the input from R4A and applying it to a Residual Income Model, generated a staggering dispersion of intrinsic valuations across major sectors (See Table 5 below):
Table 5 – China SHSZ300 Sectors – Intrinsic Valuations
R4A Input & Residual Income Model (as of February 18)
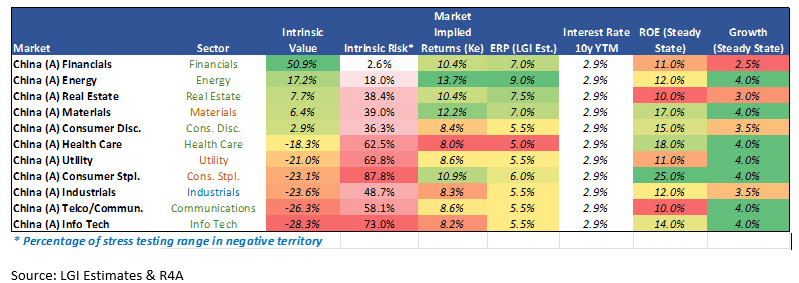
At 50 % plus, Financials seem to be priced for distress. Energy is again a no-brainer, and ditto for Materials. Real Estate everybody knows the story. However, what is most surprising from the Table is the massive downside across a variety of sectors, defensive and cyclical alike ... contradicting the very bullish narrative on China currently out there ... i.e., the recovery may have been already priced in following the rally since October last year. We are not sure China is as obvious a trade as implied by the consensus out there. And given the dispersion of fundamental highlighted in R4A, we would prefer low directional risk and healthy relative value exposures.
Using the Pre-Defined Universes
The expected returns for the set of R4A Pre-defined investment universes seem to infer the same conclusion of stretched valuation across most global markets. As the Heat Map (of returns across these pre-defined) shows, cyclical and aggressive strategies are the least attractive, mostly reflecting expensive market-implied valuation
(click => Create Customized Investment Universe => Predefined => Heat Map). In fact, the Defensive strategy has both higher returns and a better Sharpe Ratio compared to the previous two, reflecting in our view the attraction of the Value factor currently.
Table 6 – Heat Map (Est. Returns of Pre-defined investment strategies)

However, the best value seems to be in the Income oriented strategy, boasting the highest returns across the three main sections of our set of Efficient Frontiers (min. Variance, Max Sharpe Ratio, and Max Return). This result in our view is a combination of the current attractiveness of the Value, Quality, and Dividend factors plus the return of (some) value in the fixed income. Furthermore, and as it turns out from the optimized Max Sharpe ratio portfolio, the Income strategy is just as defensive, being very well diversified, stressing quality, and with a ~41 percent allocation to bonds (See Graph 2 below), bringing back to life the much-browbeaten 60/40 old precept. Notice the small position (3.6%) as well in High Yields as spreads are now wider than the cost of equity ... i.e., they have priced in recession ahead of the equity market!
Graph 2: LGI Income Universe Optimized – Asset Allocation (%)

Combining all the above, R4A output suggests to:
Use the Income Predefined universe as a defensive strategy ... carry, quality, dividend, and effective diversification.
Use a combination of both the Income and the Defensive universes as the core position for a Core-Satellite strategy ...
... add from the Discovery and Strategies analyses above as satellites to customize exposure and match goals.
[1] From Investopedia: Take, for example, a software maker such as Microsoft. The bulk of this company's cost structure is fixed and limited to upfront development and marketing costs. Whether it sells one copy or 10 million copies of its latest Windows software, Microsoft's costs remain basically unchanged. So, once the company has sold enough copies to cover its fixed costs, every additional dollar of sales revenue drops into the bottom line. In other words, Microsoft possesses remarkably high operating leverage.
[2] In corporate finance, as part of fundamental analysis, economic value added is an estimate of a firm's economic profit, or the value created in excess of the required return of the company's shareholders. EVA is the net profit less the capital charge for raising the firm's capital. Wikipedia