


What Drives American Exceptional Stock Performances in the Past 5 Years?
Using Lumen R4A to screen and build a high-quality stock portfolio

Introduction
Over the past 15 years, American stocks have demonstrated exceptional performance, outpacing other developed markets by about 9% per annum (see Chart 1 below). This trend, rooted in several key factors including faster revenue growth, greater margin expansion, and more significant multiple expansion, has accelerated in the past 5 years.
These characteristics are neatly embodied in the "Quality" factor in investing, which Lumen measures by positive return on equity (ROE), moderate debt-equity ratio, steady earnings growth, and positive economic value added (EVA).
The U.S. leads globally (~20% of the total universe) in the quality category, particularly in the Information Technology and Communication Services sectors. The concentration of “Quality” companies has been instrumental in driving the exceptional returns of the U.S. market, justifying US valuation due to its strong fundamentals.
It is important to note that “Quality” can also be found in the other 10 GICs sectors and countries outside the U.S. based on our further analysis, given the current high concentration risk in the U.S.
Overview of the Quality Factor in Investing
In a previous post, we discussed the evolution of factor investing, where factors are defined as “characteristics” that drive the differences in risk or the rate of return in stocks. Common factors include size, growth, value, quality, dividend, momentum and volatility.
Since 2010 and especially in the past 5 years, U.S. stocks (S&P 500, proxied by the SPY ETF) have outperformed the rest of the developed world (EAFE, proxied by the EFA ETF) by 9% on a compounded annual average basis. Such excess performance has come from faster revenue growth, bigger margin expansion, and more multiple expansion of US stocks (S&P 500) (Table 1).
Chart 1 (S&P 500 vs. MSCI EAFE, proxied by SPY vs. EFA (ETF) returns) from end-2010 to December 2024
Source: Koyfin

Table 1 (Contribution of Stock Total Returns (2010s to Today)
Source: Bridgewater

One equity factor that embodies all the above characteristics of U.S. stocks is “Quality” (defined below)--the U.S. has the highest number (20% of the total, see Chart 2), followed by Japan, India, China, and Taiwan, according to our screening. The UK, while outranking the rest of the European countries, comes 13th in the rank with 16 quality stocks, followed by Sweden at 14.
Looking at the number of quality stocks as a percentage of the entire country stock universe, Sweden and Switzerland top the ranks with 70% and 50% of the stocks in their main indices ranked as “Quality” while only 5% of the U.S. stock universe is selected as “Quality” (granted, U.S. has about 8000 tradeable securities).
Chart 2 (Screened Quality Stocks by Countries)
Based on the ~900 quality stocks screened out of a 15,000 global stock universe
Source: lumenr4a.com

We screened out over 900 quality stocks globally out of almost 15,000 stocks within the major benchmarks across developed, emerging, and frontier markets, focusing on stocks that are at least USD 100 million in market capitalization, based on data as of September 30, 2024.
To determine what constitutes “Quality” in our universe, we look for stocks with a positive trailing 12-month return on equity (ROE), a debt-to-equity ratio that is less than 3x, steady/stable 5-year EPS growth rate variability[1], and a model score of at least 50 (out of 100).
Then we pick out stocks with positive economic value added (EVA), proxied by ROE minus the Lumen market-implied cost of equity (Ke). EVA measures the difference between net profits generated by a company and its cost of equity. When EVA spread is positive and high, that means the company is generating excess profit over its capital invested, i.e., generating value from capital invested.
Table 2 below shows on average the quality stocks have very high EVA, ROE, low EPS variability and fairly low debt-to-equity ratios.
Table 2 (data as of 9/30/24)
Based on the ~900 quality stocks screened out of a 15,000 global stock universe
Source: lumenr4a.com

The Information Technology sector dominates the quality universe, constituting about 20% of our Quality stock universe (Table 2). These “Quality” Information Technology Stocks contributed 61% of the 29% past-5-year annual average return (to 9/30/24) based on market-cap weights. The second big contributor is communication services (14% of total return) (see Chart 3).
The U.S. has a good concentration of high-quality information technology stocks (34% of the total number of stocks in the US are in information technology as proxied by the Total Stock Market ETF VTI), and communication services stocks.
Chart 3
Based on the ~900 quality stocks screened out of a 15,000 global stock universe
Source: lumenr4a.com

Market-Cap Weighted Returns Versus Simple Average Return Tells a Different Picture
From a country perspective, it is not surprising the U.S. is the overwhelming winner, contributing 76% of the 29% past-5-year annual average return to 9/30/24 (versus the S&P 500 of 10% p.a.), helped by Information Technology (67% of total) and Communication Services (18% of total) (Chart 4).
Chart 4
Based on the ~900 quality stocks screened out of a 15,000 global stock universe
Source: lumenr4a.com

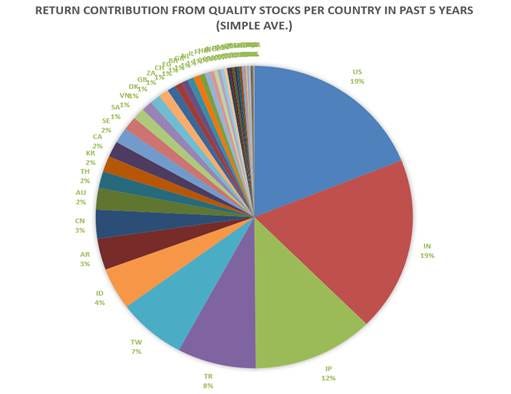
Using simple average return in the past 5 years (i.e., averaging the return of the quality stocks in each country), the return distribution by country looks a lot more even with U.S. stocks contributing 3.88% (19% of the total) of the 20.52% average return, followed closely by India (19%), Japan (12%), Turkey (8%), and Taiwan (7%) (see Chart 5).
Chart 5
Based on the ~900 quality stocks screened out of a 15,000 global stock universe
Source: lumenr4a.com
Conclusion
The exceptional performance of U.S. stocks over the past five years stems from its strong fundamentals--faster revenue growth and greater margin expansion, accompanied by significant multiple expansion.
The "Quality" factor, a part of factor investing, characterized by positive ROE, moderate debt-equity ratio, stable earnings growth, and positive EVA, plays a crucial role in U.S. outperformance. The U.S. leads globally with 20% of all quality stocks as screened by Lumen, particularly in the Information Technology and Communication Services sectors.
While market-cap-weighted returns show U.S. dominance (76% of the 29% average annual return), a simple average return analysis reveals a more balanced global distribution of return contribution. This highlights that quality stock opportunities exist across countries and sectors, and are not monopolized by the U.S., justifying the importance of evaluating global quality investment prospects, especially in light of the current heavy concentration risk in the U.S. stock market.
Appendix:
For a more interactive tool to view our Quality stocks universe, please visit our Tableau page. You can download the Tableau dashboard and the data (and customize what you like to download).

How do we use Lumen R4A (Enterprise version) to build a high-quality portfolio customized and optimized with large-cap stocks in the developed market only? Please click on the below four-minute video for a step-by-step guide.

For a customized demo of Lumen R4A, please get in touch with us at lumen@lumenadvisors.com.
Marianne O
[1] EPS variability is measured by the standard deviation of year-on-year EPS growth over the last 5 fiscal years (3 years if not available.) Quality stocks that have more stable and positive EPS variability rank higher.